
Taken in isolation, Q4 2022 was a pretty good quarter for the markets. The S&P returned +7.55% while the Dow Jones returned +16.01%. Even the fixed income markets saw a bit of relief, with the Bloomberg Aggregate Bond Index up +1.87% and the Bloomberg US High Yield Index up +4.17%. Yet, we know that’s only part of 2022’s story. Most investors didn’t get their holiday wish as the “Santa Claus Rally” in December was minimal (at best). From a full year perspective, most investments ended the year down. Stocks had their worst year since 2008. Since 1926, when the S&P 500 Index’s predecessor was created, there have only been 6 years that the S&P 500 had a worse return. For the year, the S&P 500 returned a -18.13%. Bonds, represented by the Bloomberg Aggregate Bond Index, continued a turbulent few years, with their worst calendar year ever (by magnitudes). They returned a -13.01%.
Some may argue that fixed income is a safe haven for investors, as it’s commonly believed bonds rise in value when stocks fall. However, that wasn’t the case in 2022. Yet, the tandem decline is relatively rare and there is hope for battered bonds. 2022 was the first time since its inception that the Bloomberg Barclay’s Aggregate Bond Index returned two consecutive negative years in a row, a feat (or lack-there-of) that not even the Bloomberg US High Yield Bond Index has accomplished since its inception.
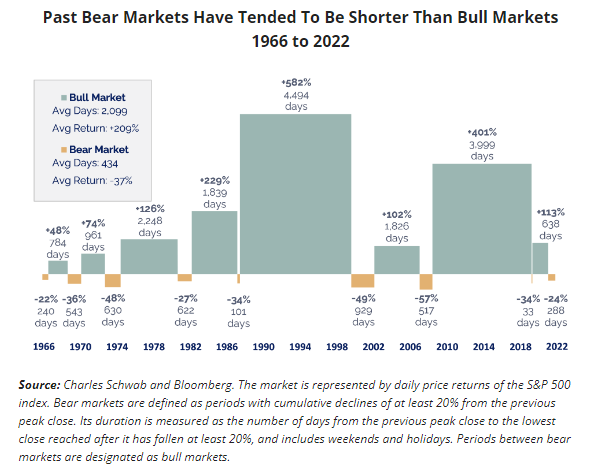
Downturns tend to test our resolve. During a bear market, negative returns can feel like they will go on forever with the daily drum-beat of bad news. The news cycle will feature plenty of reasons for doom and gloom and economic pessimism abounds. However, historically, bear markets have lasted a fraction of the time of a “bull” (up) markets. More importantly for long term returns, the average return of a bull market far exceeds the average pullback of a bear market. The news articles of 401k participants who stuck to their plan, dollar cost averaging every paycheck into and out of the Great Recession were often relegated to page 10 in the news media.
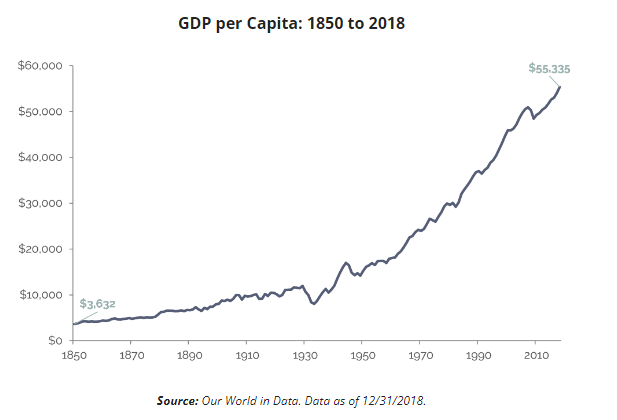
Looking back even further, since 1850, real GDP per capita in the US, a way of measuring US economic performance, has grown tremendously. Real GDP per capita is the total economic output of the United States divided by the number of people and adjusted for inflation. As we know, the investment markets don’t always perfectly mimic the economy, but they are impacted by economic growth, especially in longer time frames.
Keep in mind that in the past 170 years, there have been any number of reasons for pessimism. Here are just a couple:
Despite these turbulent times, on average, stocks and bonds have tended to go up over the long term. As a reminder, since at least the 1920s, large cap stocks (as measured by the S&P 500) have managed to return an average of about 10% annually and government bonds about 5.5%. While it’s unlikely that any of these historical events will repeat exactly, and past performance is not an indicator of future results, knowing that history has provided ample opportunities to be pessimistic and yet the markets have continued to perform should serve as a reminder that there are always opportunities.
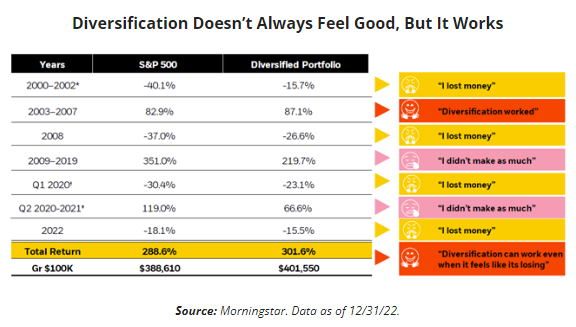
In the face of the negativity, it can be hard to maintain a positive outlook and keep in mind the longer-term picture. A diversified portfolio works even though it often doesn’t feel great. Since the turn of the millennium, which encompasses a period including 9/11, the 2008 “Great Recession”, the start of the Covid-19 pandemic and last year, a diversified portfolio of stocks and bonds could have returned over 300%. This is despite at least four different periods where the portfolio experienced a decline of over 15%!
So, what does this year hold? While we don’t know exactly when this market will turn around, history argues for patience, having and most importantly sticking to a plan. Rebounds after steep declines help investors capture the benefits of markets but those that abandoned their plans may not have a chance to participate in the rallies. It is time in the market, not timing the market, that we believe is the best path toward securing financial success.
There are also always reasons for positivity. While it’s easy to look back at the last 170 years and point to the negatives, we should also take a moment to recognize how far we’ve come. In his book Factfulness, Hans Rosling demonstrates why “things are better than you think” and how a fact-based worldview can improve our misconceptions and outlook about global development. Here’s just a couple insights that brought a smile to our faces and optimism to our hearts:
For more information about a “fact-based worldview” and to test your own misconceptions, visit the Gapminder Foundation’s website at www.gapminder.org.
Sources:
Garrison Point Advisors, LLC doing business as “Treehouse Wealth Advisors” (“TWA”) is an investment advisor in Walnut Creek, CA registered with the Securities and Exchange Commission (“SEC”). Registration of an investment advisor does not imply any specific level of skill or training and does not constitute an endorsement of the firm by the Commission. TWA only transacts business in states in which it is properly registered or is excluded or exempted from registration. A copy of TWA’s current written disclosure brochures, Form ADV Part 1 and Part 2A, filed with the SEC which discusses among other things, TWA’s business practices, services, and fees, is available through the SEC’s website at: www.adviserinfo.sec.gov.
Certain hyperlinks or referenced websites, if any, are for your convenience and forward you to third parties’ websites, which generally are recognized by their top-level domain name. Any descriptions of, references to, or links to other products, publications or services does not constitute an endorsement, authorization, sponsorship by or affiliation with TWA with respect to any linked site or its sponsor, unless expressly stated by TWA. Any such information, products or sites have not necessarily been reviewed by TWA and are provided or maintained by third parties over whom TWA exercises no control. TWA expressly disclaims any responsibility for the content, the accuracy of the information, and/or quality of products or services provided by or advertised on these third-party sites.
Schedule a 30-minute conversation to get started.
Please fill out the form to gain access to the webinar.
Please fill out the form to gain access to the webinar.
Please fill out the form to gain access to the webinar.
Please fill out the form to gain access to the webinar.
Please fill out the form to gain access to the webinar.